S2011SQF1
S2011SQF – 017
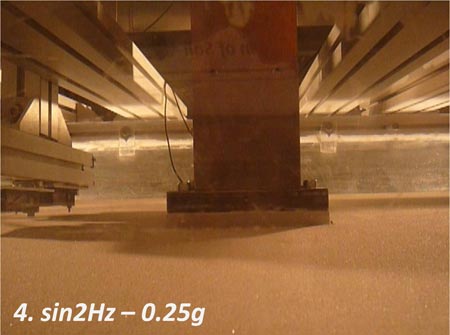
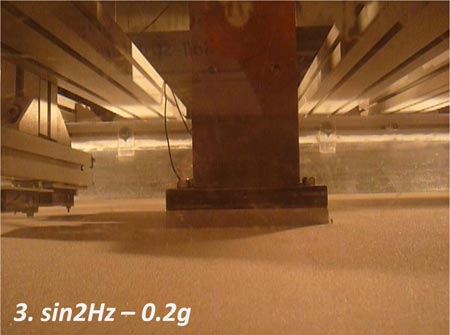
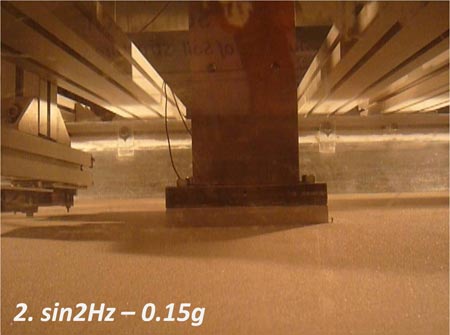
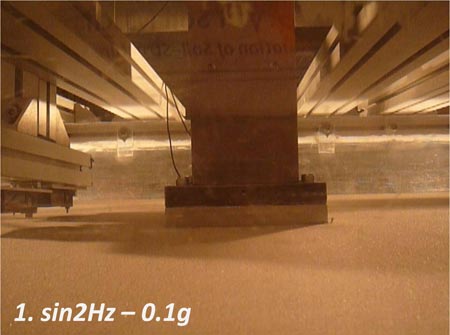
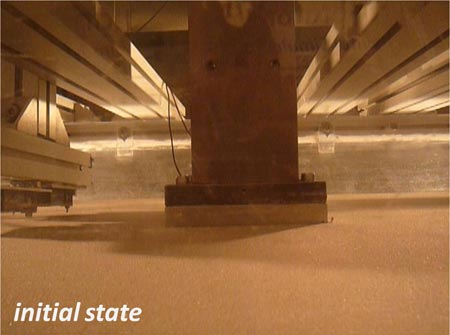
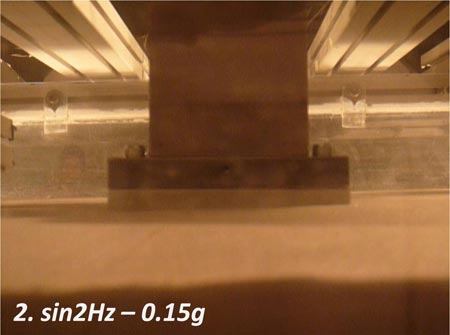
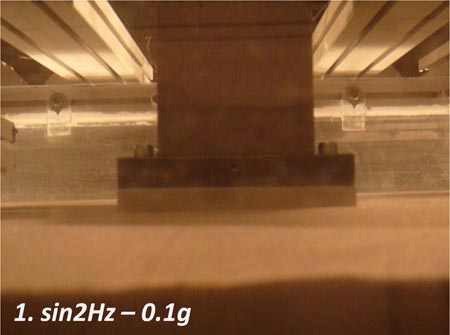
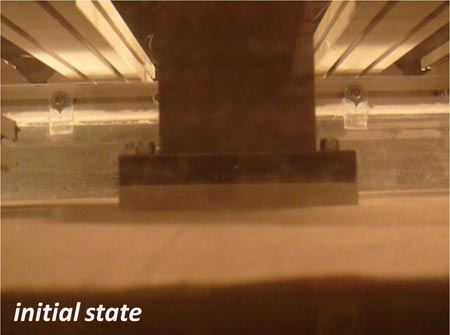
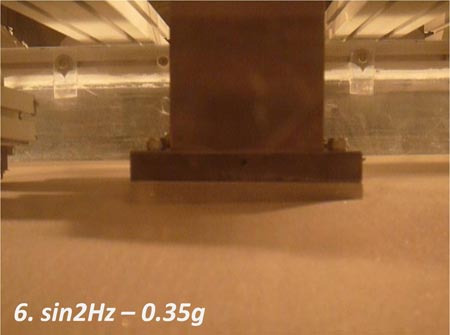
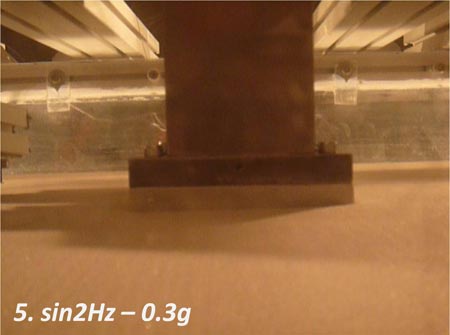
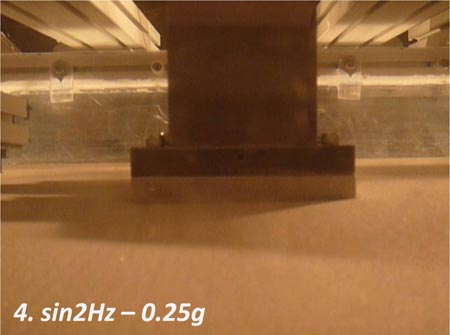
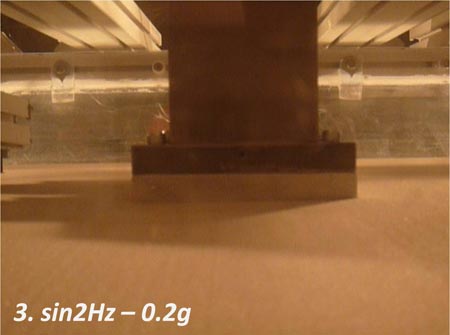
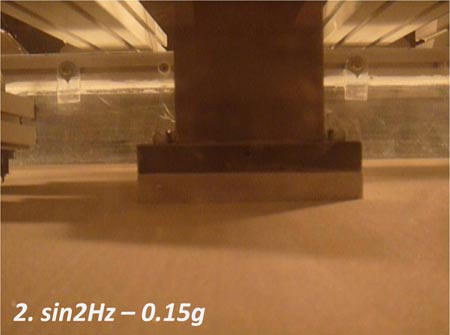
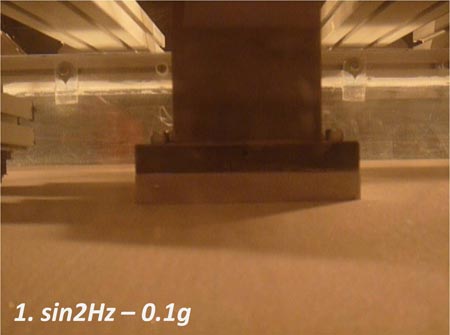
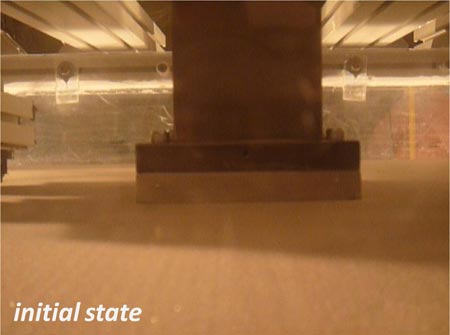
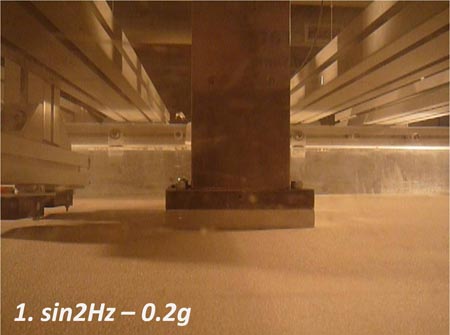
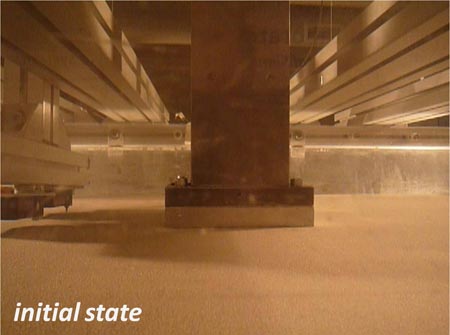
After having explored the performance of the system on the desired and on the actual soil profile, the next step is the evaluation of the effectiveness of the soil crusts. In this test the “poor” soil of relatively loose sand (Dr = 65%) is improved at depth equal to the foundation width (z/B = 1). The excitation sequence remains the same as in the previous test. In summary, the results of the test are presented in the following table:
| sin2Hz – 0.1g | ✓ |
| sin2Hz – 0.15g | ✓ |
| sin2Hz – 0.2g | ✓ |
| sin2Hz – 0.25g | ✓ |
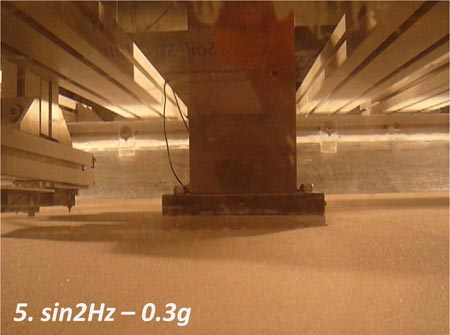
| sin2Hz – 0.3g | ✓ |
| sin2Hz – 0.35g | ✓ |
| sin2Hz – 0.4g | ☓ |
S2011SQF – 016
Having explored the systems performance on the supposed “healthy” soil profile of dense sand, the next step is to explore the performance of the system lying on the actual soil profile of relatively loose sand (Dr = 65%). The motion sequence remains the same as in the previous experiment, a combination of sinusoidal excitations with increment of 0.05g. In summary, the results of the test are presented in the following table:
| sin2Hz – 0.1g | ✓ |
| sin2Hz – 0.15g | ✓ |
| sin2Hz – 0.2g | ☓ |
S2011SQF – 015
The motion sequence employed up till now, proved to be unrealistically adverse, and not representative enough for the systems performance. To that end, a new motion sequence is adopted, consisting of sinusoidal excitation of increasing intensity, though this time, it starts at 0.10g acceleration while the increment is 0.05g. The tests of the heavily loaded model (m = 100 kg) are repeated. This tests refers to homogeneous soil profile of dense sand (Dr = 93%). In summary, the results of the test are presented in the following table:
| sin2Hz – 0.1g | ✓ |
| sin2Hz – 0.15g | ✓ |
| sin2Hz – 0.2g | ✓ |
| sin2Hz – 0.25g | ✓ |
| sin2Hz – 0.3g | ✓ |
| sin2Hz – 0.35g | ✓ |
| sin2Hz – 0.4g | ☓ |
S2011SQF – 010
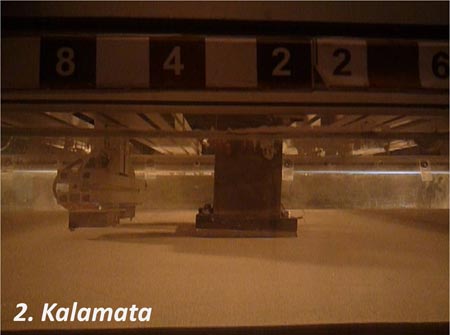
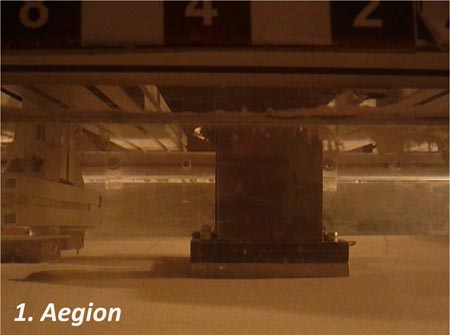
The last step, in order to complete the investigation concerning the first system tested in this series, is the evaluation of the performance of the z/B = 0.5 crust when subjected to real earthquake records. The experimental setup remains the same as in the experiment 009. In summary, the results of the test are presented in the following table:
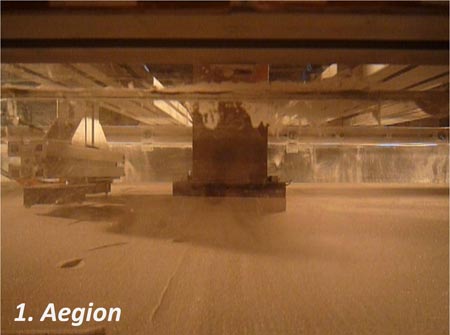
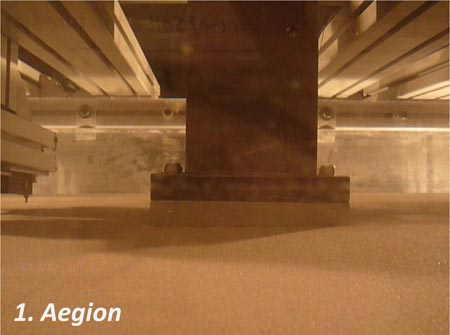
| Aegion | ✓ |
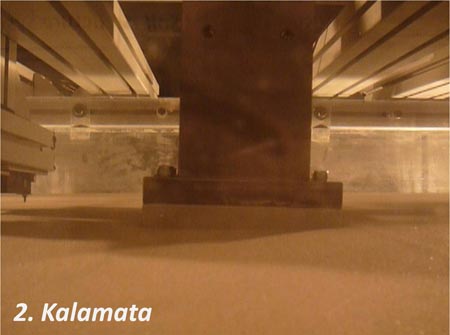
| Kalamata | ✓ |
| Lefkada 2003 | ✓ |
| JMA_000 | ☓ |
S2011SQF – 006
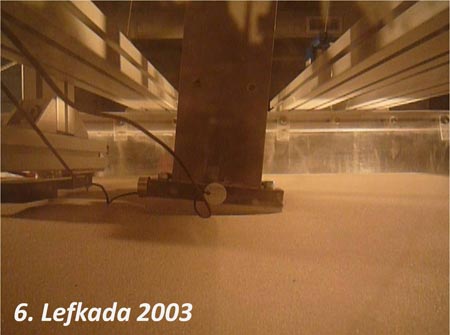
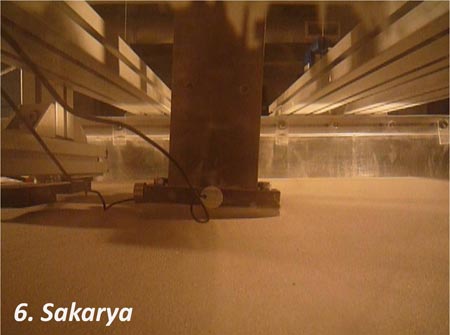
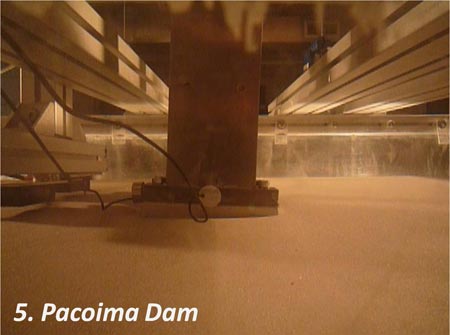
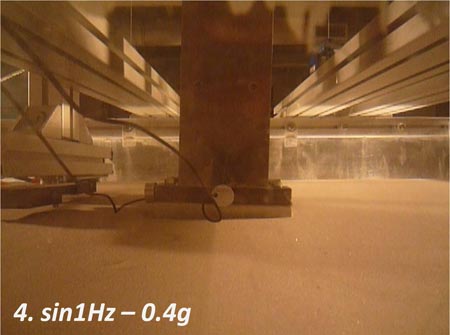
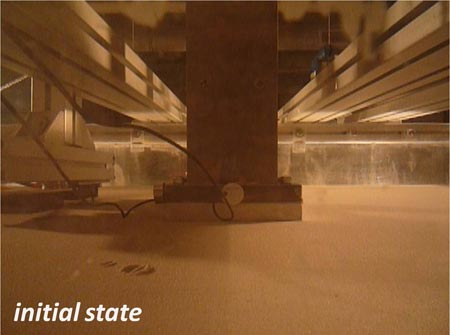
After having explored the performance of the foundation – structure system in the supposed poor soil profile (very loose sand) and in the desired healthy one (dense sand), from this test on, the aim is to evaluate the effectiveness of a soil crust. In this experiment the model properties remain the same (m = 35 kg), but the soil consists of two layers. The underlying layer represents the supposed poor soil (loose sand) while the upper layer represents the applied soil improvement (dense sand). The depth of the soil crusts is equal to the width of the foundation (z/B = 1) and the FSV = 9.8. The motion sequence is the combination of sinusoidal excitations and real records, as imposed in previous experiments. The performance of the system can be summarized as following:
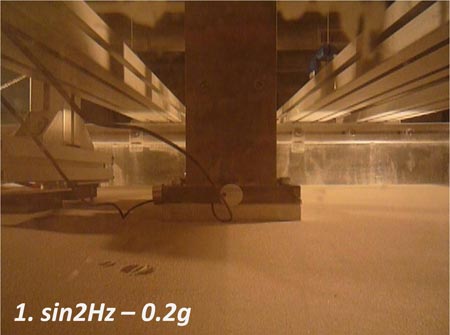
| sin2Hz – 0.2g | ✓ |
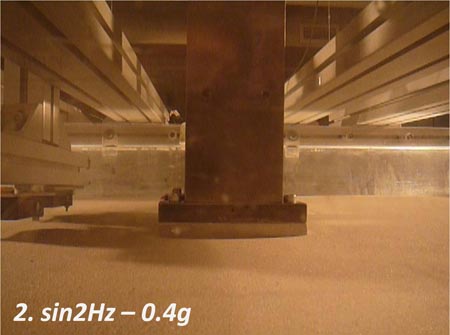
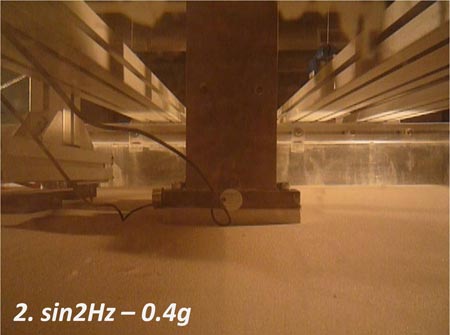
| sin2Hz – 0.4g | ✓ |
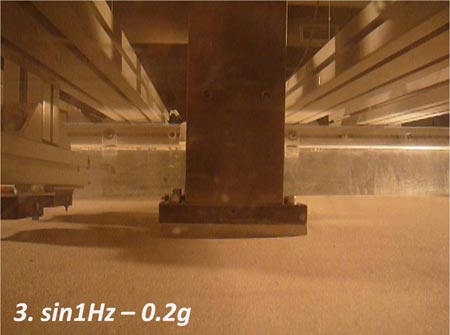
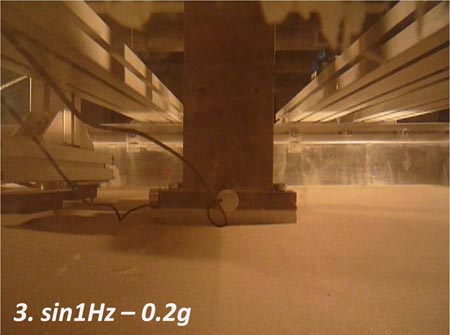
| sin1Hz – 0.2g | ✓ |
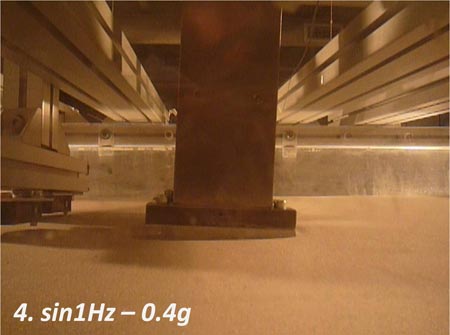
| sin1Hz – 0.4g | ✓ |
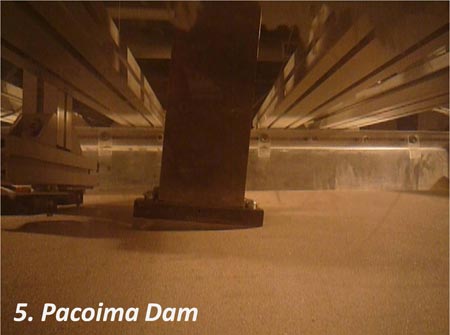
| Pacoima | ✓ |
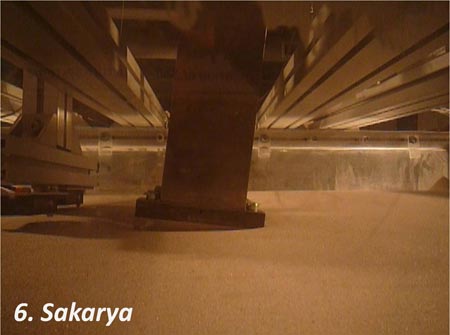
| Sakarya | ✓ |
| Lefkada 2003 | ☓ |
S2011SQF – 005
The system tested in experiment 004 (m = 35 kg, loose sand Dr = 45% and FSV = 5) is subjected to the sequence of real records. The performance of the system can be summarized as following:
| Aegion | ✓ |
| Kalamata | ✓ |
| Lefkada 2003 | ☓ |
S2011SQF – 003
The sequence consisting of sinusoidal excitations of 30 cycles proved to be a rather intense excitation. In order to be more realistic in terms of base excitation, test S2011SQF–001 is repeated but this time the sequence changes. It consists of 4 sinusoidal excitations of varying intensity and frequency and 3 real earthquake records. In this sequence the performance of the system can be summarized as following:
| sin2Hz – 0.2g | ✓ |
| sin2Hz – 0.4g | ✓ |
| sin1Hz – 0.2g | ✓ |
| sin1Hz – 0.4g | ✓ |
| Pacoima | ✓ |
| Sakarya | ✓ |
| Lefkada 2003 | ✓ |

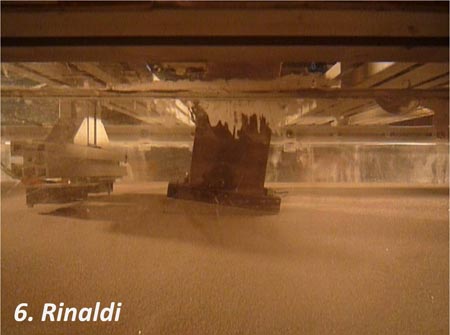
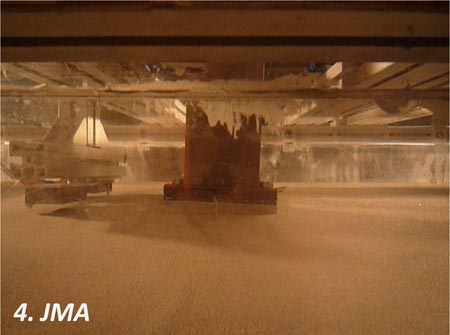
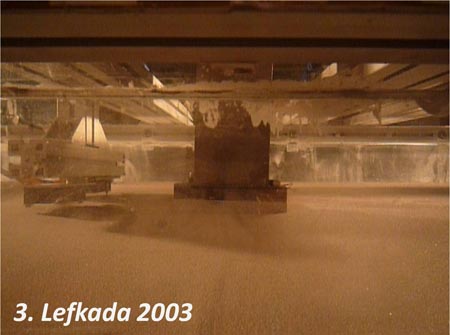
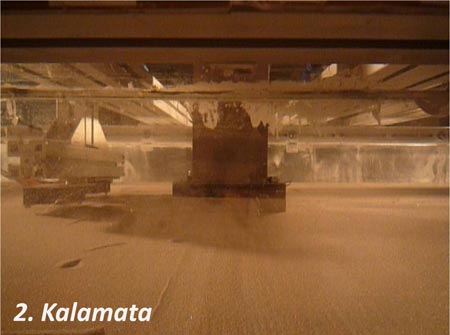
S2011SQF – 002
In this test, the foundation–superstructure model has a superstructural mass of 35 kg and being founded on dense sand of relative density Dr = 93% yields a FSV = 14. The motion sequence consists of 6 real earthquake records of increasing intensity. In this sequence the performance of the system can be summarized as following:
| Aegion |
|
| Kalamata |
|
| Lefkada 2003 |
✓
|
| JMA_000 |
✓
|
| Rinaldi_228 |
|
| Takatori_000 | ☓ |